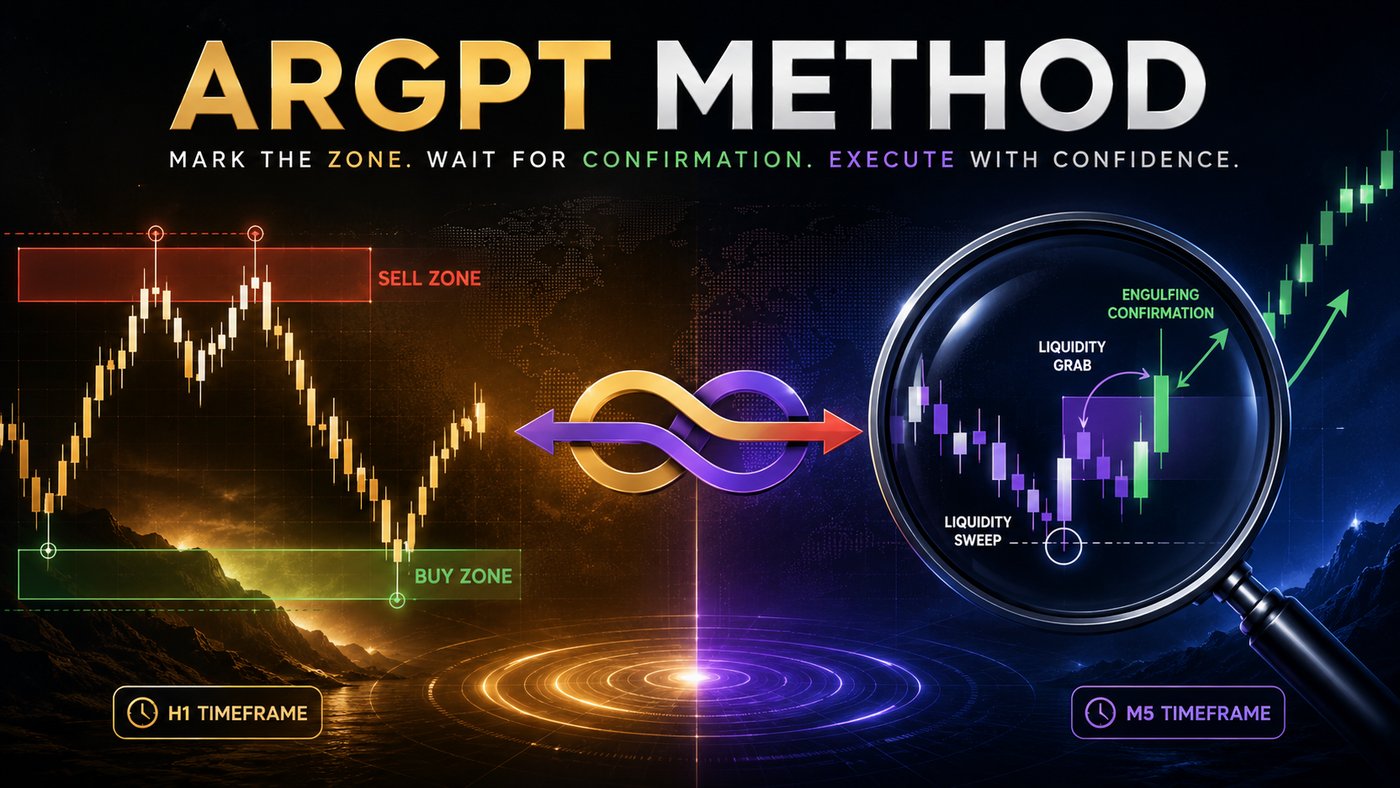
What is the ARGPT Method?
The ARGPT Method is a trading framework I developed and documented in the ARGPT Trader Club E-Course.
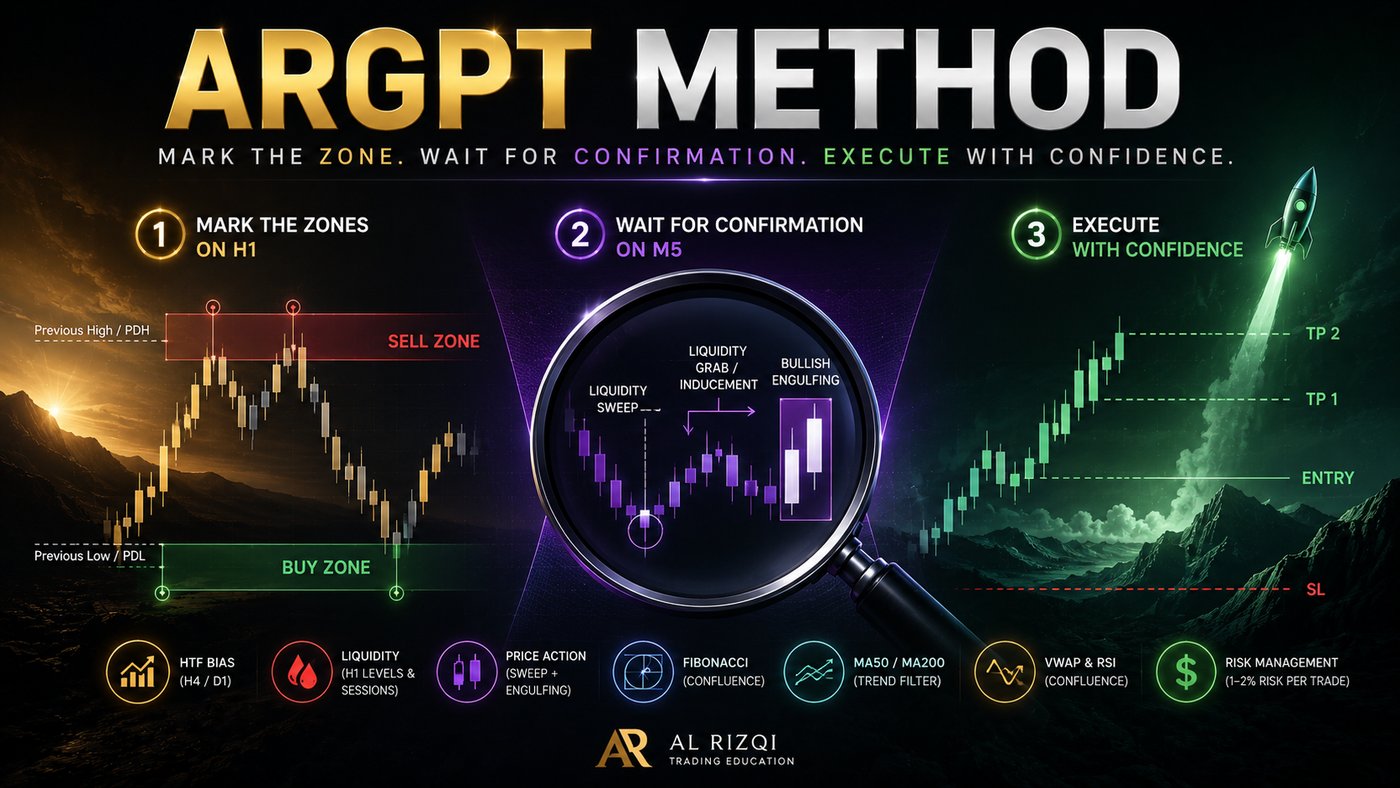
ARGPT does not rely on a single indicator to tell you when to buy or sell. It is a structured way to read the market: start from the higher timeframe, mark the liquidity levels that matter, wait for price action to confirm, and manage risk once the trade is open.
The framework combines several concepts:
- Higher-timeframe market bias
- Liquidity and previous session highs and lows
- H1 and H4 high and low levels
- Candle and wick psychology
- Sweep and engulfing patterns
- Fibonacci levels
- Moving Average 50 and 200
- VWAP and RSI as supporting confluence
- DXY as an inter-market confirmation
- Structured entry and position management
- Risk management and risk-reward planning
The course focuses on how these components work together.
Learn the full ARGPT Method for free
This article is only an introduction. The complete ARGPT Trader Club E-Course goes much deeper into the framework, from trading mindset and platform setup to candle psychology, liquidity, entry, and risk management.
The E-Course runs seven episodes. I built it from my own trading, including more than IDR 150 million in losses while I was learning.
The E-Course is free. The course materials and the video version are here:
Learn the framework, test it yourself, and build the skill to make your own trading decisions instead of relying on signals or someone else's entries.
The philosophy behind ARGPT
Before any charts, the course starts with mindset.
Trading takes patience and a willingness to learn, and a loss you never review is the most expensive kind.
ARGPT also takes a strong position against blind dependence on signals, Expert Advisors, copy trading, or mentors.
That includes depending on me. The course is meant as a reference, not a "holy book."
Understand the setup, test it, journal it, and then make the decision yourself.
The seven parts of the ARGPT framework
Episode 1: Mindset & Framework
Build independence, patience, discipline, and a structured approach to learning.
Episode 2: Trading Accounts
Understand CFD, Futures, demo accounts, prop firms, and the progression toward live trading.
Episode 3: Trading Platforms
Use TradingView for analysis, MT5 or cTrader for execution, and AI tools as a second opinion.
Episode 4: Candle & Psychology
Read wick and body behavior and identify the core ARGPT candle patterns.
Episode 5: Indicators & Confluence
Use MA50/200, Fibonacci, VWAP, RSI, and ARGPT indicators within a defined hierarchy.
Episode 6: Liquidity & Entry
Identify liquidity, distinguish reversal from continuation, and combine the framework into an independent entry process.
Episode 7: Risk Management
Control risk per trade, calculate position size, structure SL/TP, manage runners, and understand compounding.
1. Start with the higher-timeframe bias
Throughout ARGPT, you avoid deciding on lower-timeframe moves alone.
The course uses higher timeframes such as H4 and Daily to establish the broader market context.
MA50 and MA200 work as bias filters, not entry signals. Price structure matters too.
For example:
- Higher Highs and Higher Lows generally support an uptrend.
- Lower Highs and Lower Lows generally support a downtrend.
- A market moving between MA50 and MA200 can represent a transition where additional confirmation is required.
Set the context first, then react to a lower-timeframe setup.
2. Find where liquidity is likely to matter
Liquidity is one of the central concepts of the ARGPT Method.
The framework separates liquidity into external and internal references.
External Liquidity:
- Previous Asia High and Low
- Previous London High and Low
- Previous New York High and Low
Internal Liquidity:
The course also uses higher-timeframe candle ranges, particularly H1 and H4 High and Low, as internal liquidity references.
H1 and H4 carry less noise than lower timeframes, which is why the course uses them.
Don't look for an entry everywhere. First identify where the market has a reason to react.
3. Wait for price action confirmation
Price reaching a liquidity level is not a reason to enter on its own.
The next layer of confirmation is how the candles behave at that level.
The course presents four primary candle entry patterns.
Pattern 1: Sweep + Engulfing
This is the standard pattern. Price performs a sweep around a support or resistance area and is followed by an engulfing candle in the opposite direction.
Pattern 2: Judas Swing + Engulfing
This pattern looks for a sweep against the prevailing direction, followed by a doji and then an engulfing confirmation.
Pattern 3: 75% Engulfing With Previous Context
The course notes that an engulfing candle does not always need to completely engulf the previous candle to be considered useful. However, the 75% version requires supporting context such as a significant preceding move, retracement, liquidity grab, another sweep, and additional confluence.
Pattern 4: Bills Candle
Bills Candle is presented as a pattern designed around a relatively small stop-loss structure.
The setup involves a significant move, a strong wick around a support or demand area, a retracement, a second interaction with the area, and a large engulfing move.
None of these patterns guarantees a result. Each one is a probability, and its quality depends on context and confluence.
4. Use confluence, but give each factor a different weight
ARGPT does not weigh every indicator equally.
Primary:
- Candle Pattern: Sweep, engulfing, and wick psychology provide the primary entry confirmation.
- HTF Liquidity: H1/H4 and session High/Low levels identify important areas.
Secondary:
- Fibonacci: Helps identify potential reaction zones and structure SL/TP.
- MA50/200: Provides broader market bias.
Tertiary:
- VWAP: Additional context around price relative to volume-weighted value.
- RSI: Additional momentum confirmation.
5. Fibonacci has two roles
ARGPT uses Fibonacci for two specific jobs.
Finding Potential Reaction Zones:
The 50.0%, 61.8%, and 78.6% levels are used to identify potential reaction areas, particularly when they overlap with higher-timeframe liquidity.
Planning SL and TP:
Fibonacci can also be used to structure stop-loss and take-profit levels.
A Fibonacci level means more when it overlaps another relevant market level.
On its own, it is not enough to confirm a trade.
6. DXY as inter-market confluence
ARGPT also incorporates DXY as an additional layer of market context, particularly when analyzing USD-related instruments such as gold, NASDAQ, and Bitcoin.
In the framework presented in the course:
- A declining DXY can support a bullish bias for many USD-paired assets.
- A rising DXY can support a bearish bias for many USD-paired assets.
The course specifically notes that gold tends to be more sensitive to DXY movements, while NASDAQ and Bitcoin can react with different timing and intensity.
DXY is a confluence factor, not a standalone entry signal.
7. The complete ARGPT entry process
Put together, the components form a top-down decision process.
1. Check the HTF bias.
Review H4 or Daily structure, including MA50/200 and HH/HL or LH/LL.
2. Check DXY.
Determine whether DXY supports or conflicts with the broader bias.
3. Identify liquidity levels.
Mark previous session High/Low and H1/H4 High/Low.
4. Wait for price to reach the level.
Avoid entering in the middle of a move without a defined area.
5. Look for a candle pattern.
Search for a sweep, engulfing pattern, or Bills Candle at the relevant level.
6. Validate with Fibonacci.
Check whether the liquidity level also aligns with an important Fibonacci area.
7. Define SL, break-even, and TP.
Structure the trade around market liquidity and the actual price action.
8. Execute and manage the position.
Move toward break-even after the defined risk-reward milestone, secure partial profit, and allow the remaining runner to develop when appropriate.
Treat it as a way of thinking rather than a rigid checklist, and repeat the sequence until it becomes second nature.
8. Risk management comes before profit
ARGPT does not treat risk management as an optional final step.
The final episode of the E-Course makes the case that even a profitable method can blow up an account when position sizing and risk are out of control.
The framework recommends starting with approximately 1% to 2% risk per trade. A medium-risk range of 2% to 5% is presented for more experienced traders and stronger setups, while risk above 5% is not recommended within the framework.
The rule: decide how much you are willing to lose first, then calculate the position size.
Lot size should be a consequence of risk and stop-loss distance, not a number chosen because a certain profit target looks attractive.
9. Partial take profit, break-even, and the runner
ARGPT manages positions actively. Instead of closing every trade at one fixed target, you split the position into stages.
- Move the stop-loss toward break-even after the defined risk-reward milestone is reached.
- Take partial profit around the next significant target.
- Allow a smaller remaining position, known as the runner, to pursue larger liquidity targets when the market continues to move.
The runner lets a position that is already protected ride a larger move without adding initial risk.
10. Why risk-reward ratio matters
Win rate alone does not decide whether you are profitable.
For example, a strategy targeting 1:2 risk-reward theoretically needs a lower winning percentage to remain profitable than a strategy targeting 1:1, assuming the same risk structure and excluding costs and execution differences.
The course presents 1:2 as an important minimum threshold for real trading within the framework, with larger ratios becoming possible through runners and extended moves.
This changes the question from:
"How often am I right?"
to:
"How much do I risk when I am wrong, and how much can I make when I am right?"
11. Where AI fits into ARGPT
The ARGPT E-Course also incorporates AI tools such as ChatGPT and Claude.
AI is a second opinion there, not the decision-maker.
The workflow in the course:
- Use the ARGPT prompt.
- Give the AI a screenshot of the chart.
- Include the trading instrument and broker context.
- Review the AI's analysis.
- Compare it with your own analysis.
- Make the final decision yourself.
AI can show you another angle. Handing it the whole decision is another kind of dependency.
ARGPT in seven steps
Stripped down, ARGPT is a sequence of seven steps:
1. Bias
Understand the higher-timeframe environment.
2. Liquidity
Identify where price is likely to interact with meaningful levels.
3. Reaction
Wait for price action such as a sweep and engulfing pattern.
4. Confluence
Check Fibonacci, MA, DXY, VWAP, RSI, or other supporting context.
5. Risk
Define the loss before deciding the position size.
6. Execution
Enter only when the required conditions are present.
7. Management
Protect capital, take partial profit, and allow runners to develop when appropriate.
Experienced traders will recognize most of these tools. ARGPT adds the order and the weight it gives each one.
Get the full framework
This article is a summary.
The complete ARGPT Trader Club E-Course contains seven episodes covering mindset, trading accounts, platforms, candle psychology, indicators, liquidity, entry execution, and risk management.
I have made the E-Course available for free.
There is also a video version available so you can learn the material beyond the written guide.
Get the free course here: https://alrizqi.com/nav
Don't follow ARGPT blindly. Learn it, backtest it, journal the results, challenge the assumptions, and decide whether it fits how you trade.
Risk disclaimer
The ARGPT Method and the information presented in this article are provided for educational and informational purposes only. They do not constitute financial, investment, or trading advice.
Trading financial markets involves substantial risk. No trading methodology can guarantee profits, and historical or personal trading results do not guarantee future performance.
Always conduct your own research, backtesting, and risk assessment before applying any trading methodology with real capital.